August 17, 2012 01:00 AM
Gold is looking to US economic data to inform Fed QE3 expectations and shape direction while inconsistent risk trends cloud the outlook for crude oil.
Talking Points
- Crude Oil, Copper Outlook Clouded Amid Inconsistent Risk Trends
- Gold, Silver May Fall if UofM Data Weighs on QE3 Bets, Boosts Dollar
Commodity prices are treading water in European hours, with all eyes are on the University of Michigan gauge of US Consumer Confidence. Expectations call for the measure to edge slightly lower to 72.2 in August from 72.3 in the prior month. Traders will look to the report to gauge the degree of follow-though on July?s stronger-than-expected employment and retail sales figures.
Traders? response to the Retail Sales report suggests an upside surprise may be interpreted in terms of reducing Fed stimulus bets, boosting the US Dollar amid receding dilution fears. That threatens to weigh on gold and silver on fading inflation-hedge demand. The likely response from growth-geared crude oil and copper prices is unclear however, with trading patterns somewhat inconsistent of late as the late-summer lull takes a toll on trading volumes. That means finding clear trends in whatever happens over the coming 24 hours will probably prove challenging.
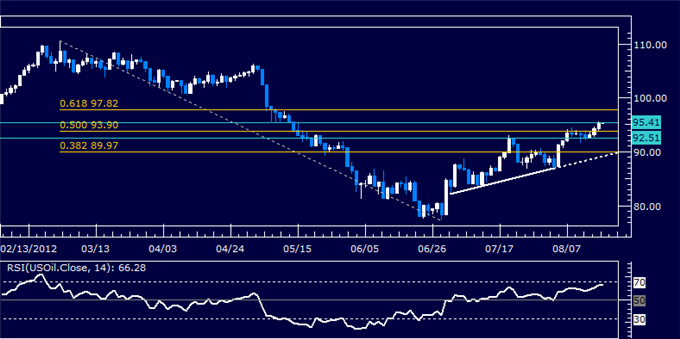
WTI Crude Oil (NY Close): $95.60 // +1.27 // +1.35%
Prices continued higher as expected after taking out resistance at 93.90, the 50% Fibonacci retracement, with buyers now testing the February 2 swing low at 95.41. A breach of this boundary clears the way for a challenge of the 61.8% Fib at 97.82. The 93.90 has been recast support, with a reversal back below that aiming for the July 19 close at 92.51.
 Daily Chart - Created Using FXCM Marketscope 2.0
Spot Gold (NY Close): $1615.10 // +12.00 // +0.75%
Prices continue to drift below resistance in the 1620.45-35.70 congestion area. Near-term support remains at a rising trend line support set from late June, now at 1598.30. A break below this boundary exposes a longer-term trend line established from the May 16 bottom, currently at 1577.26. Alternatively, a push above resistance initially targets 1677.79, the May 1 swing high.
 Daily Chart - Created Using FXCM Marketscope 2.0
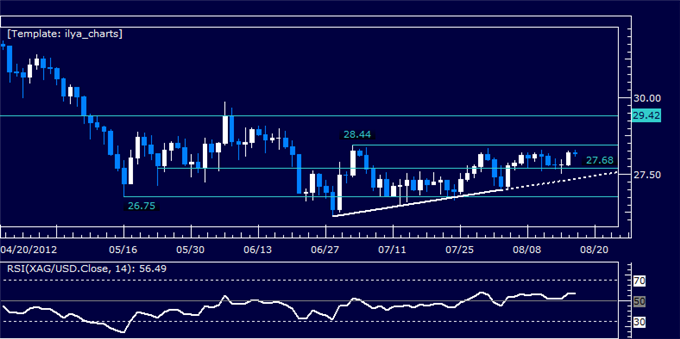
Spot Silver (NY Close): $28.22 // +0.38 // +1.38%
Prices continue to stall above support at 27.68. A break downward initially exposes a rising trend line set from the June 28 low, now at 27.36. Near-term resistance remains at 28.44, with a breach above that opening the door for an advance to challenge 29.42.
 Daily Chart - Created Using FXCM Marketscope 2.0
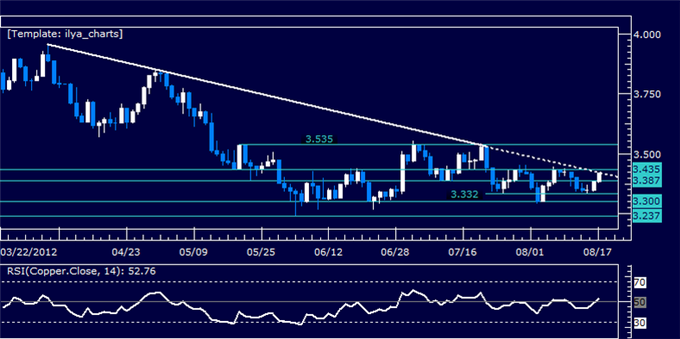
COMEX E-Mini Copper (NY Close): $3.382 // +0.032 // +0.96%
Prices are probing above resistance at a falling trend line set from the April 3 high, a barrier reinforced by a horizontal level at 3.435. A break to the upside initially exposes 3.535. near-term resistance lines up at 3.387, followed by the 3.300-32 area.
 Daily Chart - Created Using FXCM Marketscope 2.0
--- Written by Ilya Spivak, Currency Strategist for Dailyfx.com
To contact Ilya, e-mail ispivak@dailyfx.com. Follow Ilya on Twitter at @IlyaSpivak
To be added to Ilya's e-mail distribution list, send a note with subject line "Distribution List" to ispivak@dailyfx.com
Source: http://feedproxy.google.com/~r/gold-speculator/fejA/~3/umd2kjt7NJs/showthread.php
modesto detroit tigers st louis weather guinea bissau google stock google stock gawker
No comments:
Post a Comment
Note: Only a member of this blog may post a comment.